客户端安装prometheus/mysqld_exporter 信息收集
安装配置mysqld-exporter
一 下载 mysqld-exporter
下载mysqld插件,更多插件见promethues插件相关地址。下载完成后解压 mysqld_exporter-0.14.0.linux-amd64.tar.gz
mkdir /home/prometheus/
cd /home/prometheus/
wget https://github.com/prometheus/mysqld_exporter/releases/download/v0.14.0/mysqld_exporter-0.14.0.linux-amd64.tar.gz
tar zxf mysqld_exporter-0.14.0.linux-amd64.tar.gz
mv mysqld_exporter-0.14.0.linux-amd64 mysqld_exporter
cd mysqld_exporter
二 配置 mysql-exporter
1、创建mysql 用户并授权
mysqld 5.7 及以上
GRANT PROCESS, REPLICATION CLIENT, SELECT ON *.* TO 'mysql_monitor'@'localhost';
FLUSH PRIVILEGES;
MariaDB
2、在mysqld-exporter安装路径下,创建.my.cnf文件。内容如下:
user=mysql_monitor
password=Prometheus2022
三 启动 mysql_exporter
1 、直接启动 (管理不便)
2、创建系统启动文件 (建议)
cat /usr/lib/systemd/system/mysqld_exporter.service
[Unit]
Description=mysql_exporter
Documentation=https://github.com/prometheus/mysqld_exporter
After=network.target
[Service]
Type=simple
ExecStart=/home/prometheus/mysqld_exporter/mysqld_exporter \
--config.my-cnf=/home/prometheus/mysqld_exporter/.my.cnf \
--web.listen-address=:9104 \
--web.telemetry-path=/metrics
Restart=on-failure
[Install]
WantedBy=multi-user.target
管理方式:
- systemctl daemon-reload ##重载启动项配置
- systemctl start mysqld_exporter ## 启动服务
- systemctl enable mysqld_exporter ## 将服务设为开机启动
四 查看是否有数据
ps -ef | grep mysqld_exporter
root 604518 1 0 11:06 ? 00:00:00 /home/prometheus/mysqld_exporter/mysqld_exporter --config.my-cnf=/home/prometheus/mysqld_exporter/.my.cnf --web.listen-address=:9104
root 609546 589874 0 11:41 pts/0 00:00:00 grep --color=auto mysqld_exporter
如果有如上信息表示已启动成功
通过WEB IP:端口 访问
IP:9104/metrics
有信息展示则成功 , 没有通过 curl 127.0.0.1:9104/metrics 有信息, 但是页面没有, 表示防火墙限制 , 有可能是防火墙未配置Or配置不正确 ,請查看服务商的防火墻是否开启了相应的端口访问Or本机的防火墙
五 配置 Prometheus
回到 部署监控服务的机器
cat prometheus.yml
- job_name: NewProject
scrape_interval: 30s
static_configs:
- targets: ['47.241.29.98:9104']
labels:
instance: NewProject _MySQL
如果同一主机有多个监控也可合起来写
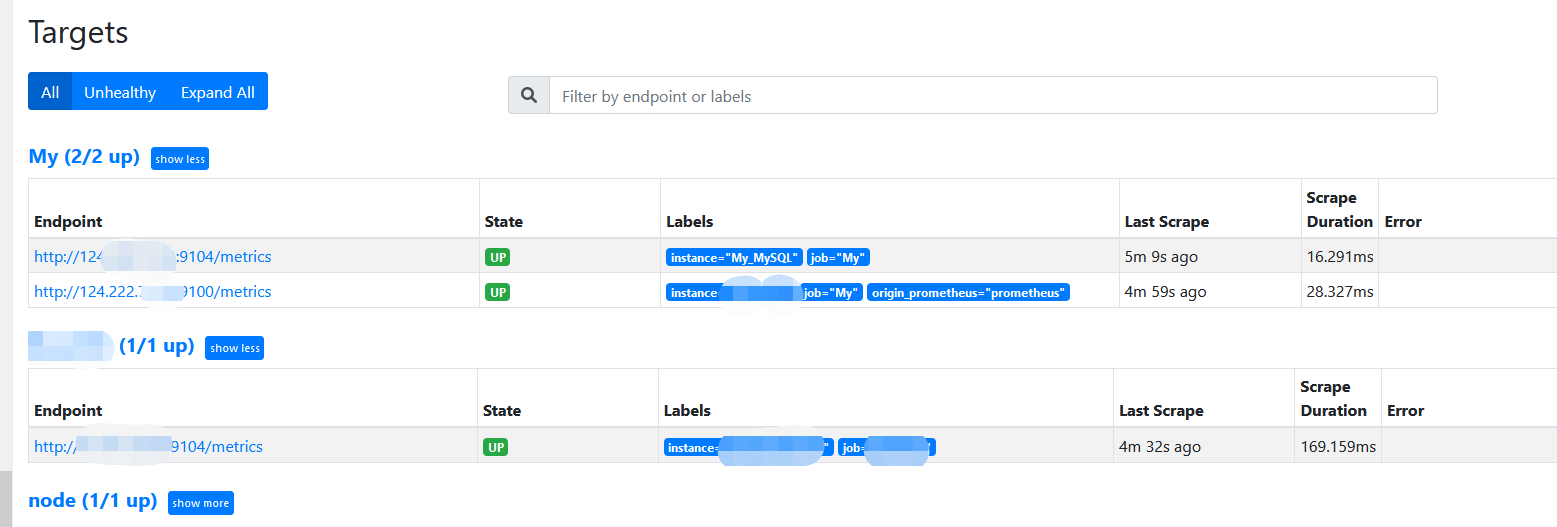
- job_name: My
static_configs:
- targets: ['124.222.7.143:9100']
labels:
origin_prometheus: prometheus
instance: Baron-SH
- targets: ['124.222.7.143:9104']
labels:
instance: My_MySQL
重启 prometheus.yml (注意 有着严格的格式)
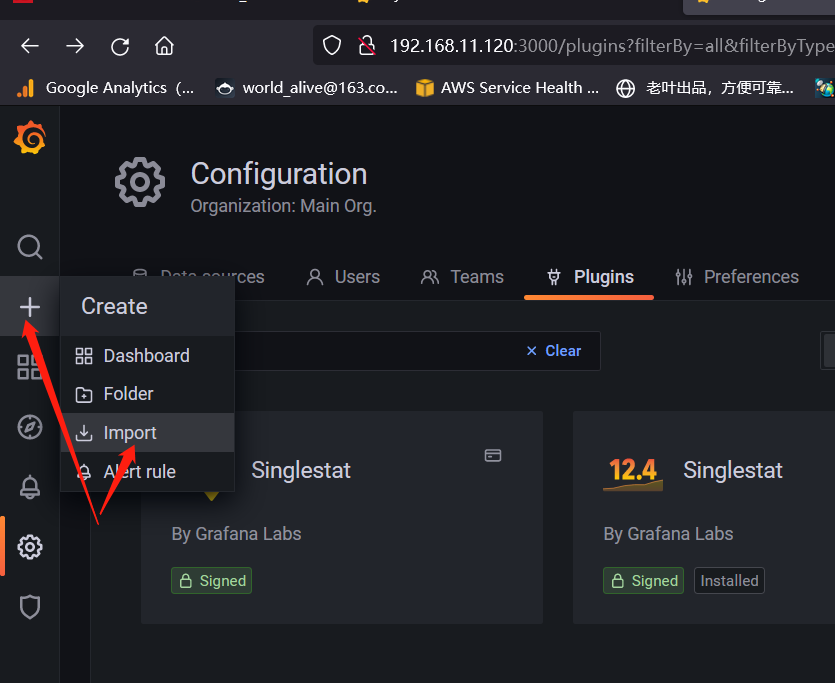
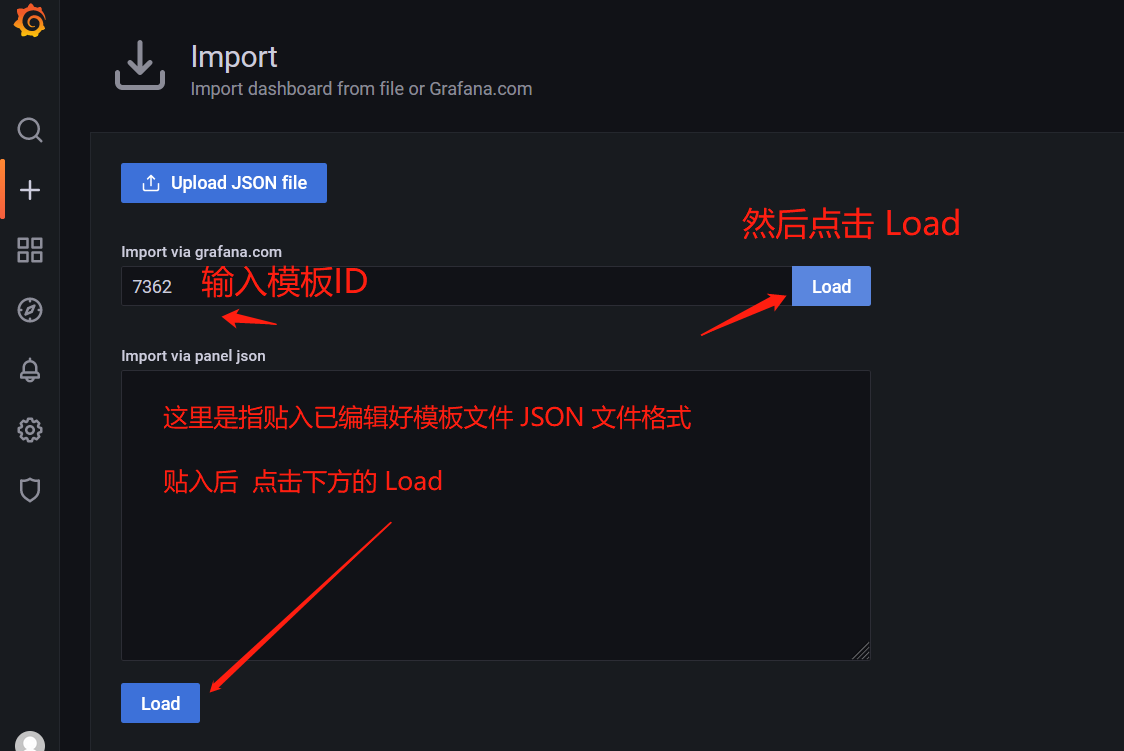
6 配置 Grafana
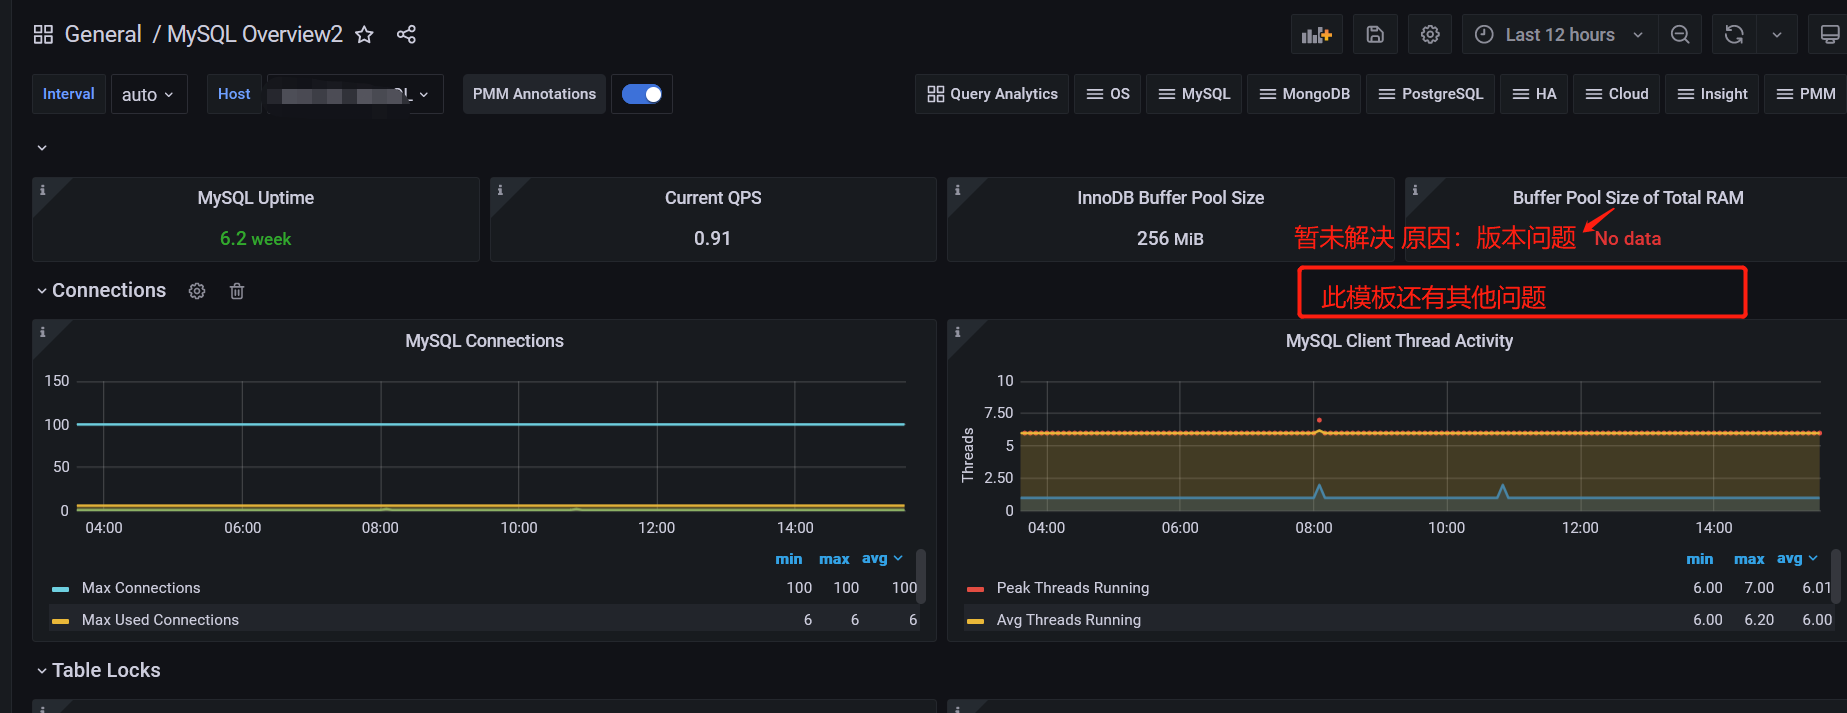
导入模板 7362 此模板比较全面“好看” , 但是存在兼容问题 , 原因是此模板是基于 Grafana 5.2.1 Prometheus 5.0.0 ,现在的版本早已升级,模板内有参数以改变
查看 效果 DashBoard -> Browse -> Mysql OwerView
没有评论